
Visualization
Pro-Series: The Intensity Lens – Mapping Byte-Level Energy
Color is information. Discover how the Intensity Lens uses the vivid structural map to highlight areas of high activity.
VFP Designer
January 23, 2026
2 min read
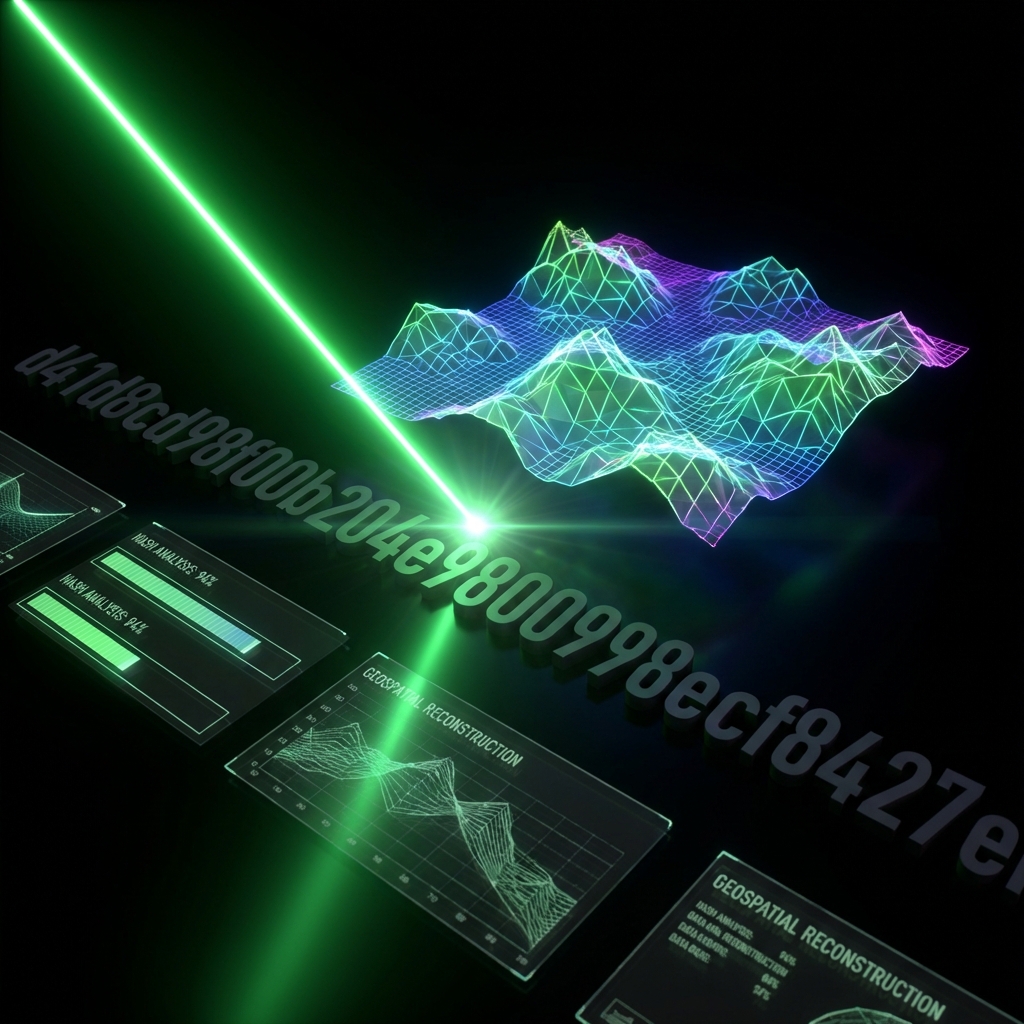
In the VFP topography, height is only half the story. The Intensity Lens adds "heat" to the map, representing the sheer density of data at any given point.
Vivid Structural Mapping
By mapping byte values to a dynamic color spectrum, the Intensity Lens allows operators to spot "energy spikes" that signify packed code or nested assets. It turns a boring data audit into a vibrant, high-discovery visual experience.
#Pro-Series
#Visualization
#Color-Mapping